Concept for ECO₂
The Speece Cone® in 3D.
- Made for
- ECO₂ Technologies
- Industry
- Water treatment and oxygen injection technology
- Location
- United States
- Year
- Concept · 2026
- Scope
- A working 3D Speece Cone® to turn, cut open and run in the browser
- Disciplines
- 3D modeling, Interactive design, Frontend development
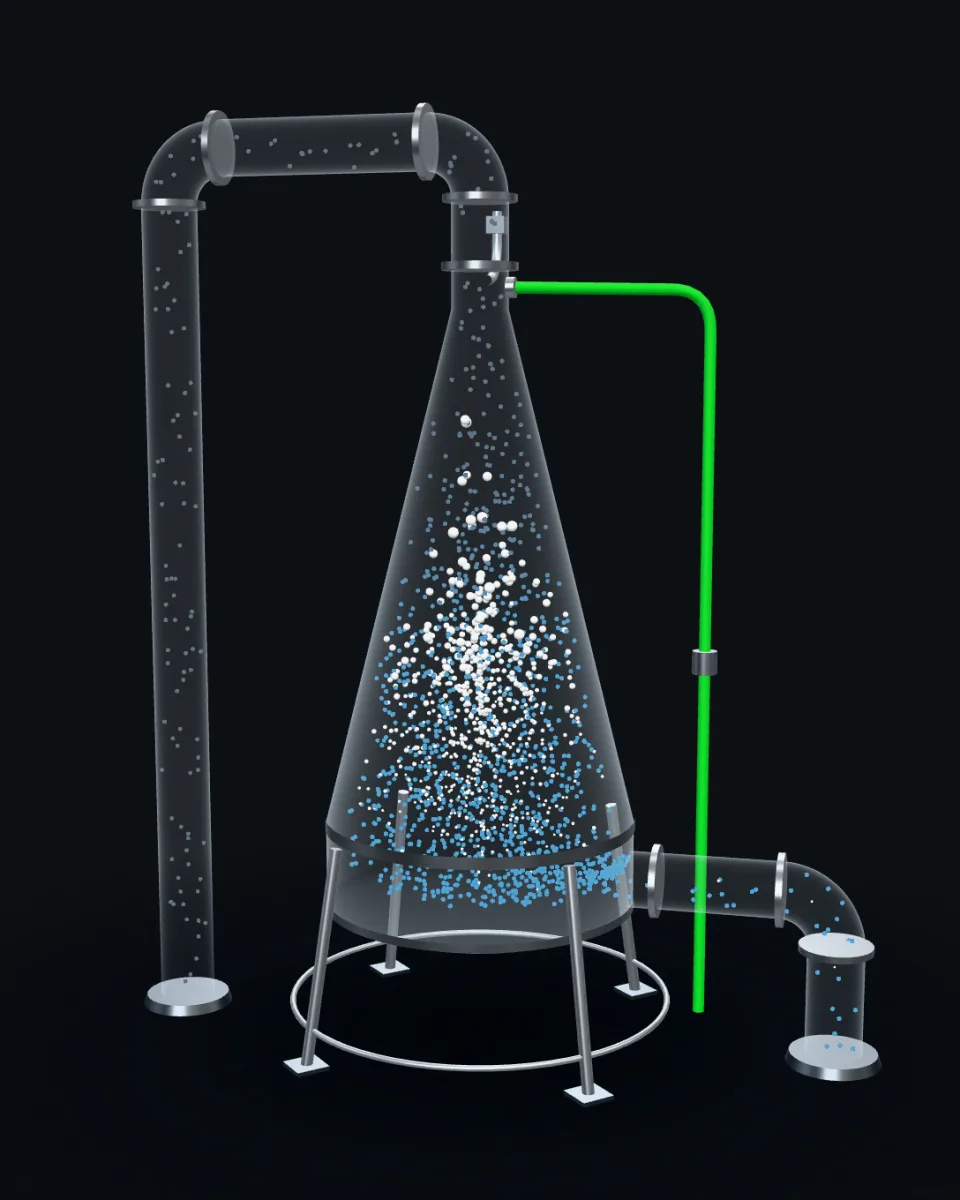
A see-through Speece Cone on a steel frame. Water comes in at the narrow top with pure oxygen, a swarm of bubbles hangs partway down the cone, and oxygen-rich water leaves through a pipe near the bottom.
Model estimates
- State
- Held
- Oxygen in the water outFrom 1.0 mg/L in
- 33 mg/L
- Oxygen absorbed
- 98%
Key
- Water inLow in oxygen, at the narrow top
- Pure oxygen inAt the top with the water
- Bubble swarmHeld while it dissolves, drawn 30 times bigger than life
- Oxygen-rich water outNear the bottom. The color follows the model’s dissolved oxygen.
Model estimates from McGinnis and Little’s published bubble model, run for an illustrative cone about 10 ft tall and 6 ft across. Not ECO₂ design data or a performance claim.
Start from an application
Model estimates
- State
- Held
- Oxygen in the water outFrom 1.0 mg/L in
- 33 mg/L
- Oxygen absorbed
- 98%
Model estimates from McGinnis and Little’s published bubble model, run for an illustrative cone about 10 ft tall and 6 ft across. Not ECO₂ design data or a performance claim.
Settings
Model estimates
- State
- Held
- Oxygen in the water outFrom 1.0 mg/L in
- 33 mg/L
- Oxygen absorbed
- 98%
Model estimates from McGinnis and Little’s published bubble model, run for an illustrative cone about 10 ft tall and 6 ft across. Not ECO₂ design data or a performance claim.
Model estimates
- Against air-saturated waterAir saturation here: 9.0 mg/L
- 3.7 times
- Nitrogen strippedTaken out of the water by the bubbles
- 0.5 mg/L
- Where the swarm sitsMost of the gas, measured from the cone’s top
- 4.9 ft to 8.5 ft down
- Water speed in at the topBubbles rise at 0.75 ft/s
- 10 ft/s
- Water speed at the bottomMust stay below the rise speed
- 0.28 ft/s
Model estimates from McGinnis and Little’s published bubble model, run for an illustrative cone about 10 ft tall and 6 ft across. Not ECO₂ design data or a performance claim.
Start from
Water and oxygen
Prices
Results
- Oxygen to buy
- 1,180 lb a day
- Water through the cones
- 1,480 gpm
- Cone size, across the base
- 5 ft
- Number of cones
- 1
- Pump power
- 5.6 kW (7.5 hp)
- Running cost a yearElectricity $4,870, liquid oxygen $20,800
- $25,700
The assumptions behind these numbers
Oxygen to dissolve: the flow times the oxygen it needs. The starting 3 MGD is Milford’s average force main flow. The starting 42.5 mg/L is ECO₂’s force main example: 4 hours at 10 mg/L an hour, 2 mg/L for each of the 1 mg/L of sulfide already there, and 0.5 mg/L left at the end. Our arithmetic Bradstreet, Smith & Bowker (AECOM), Milford, p.11ECO₂ Force main checklist, p.1Our arithmetic Force main checklist, p.1ECO₂ Bulletin, oxygen demand, p.1Our arithmetic Rogers 2020, El Paso, p.4Our arithmetic Bulletin, oxygen demand
90% of the oxygen dissolves: ECO₂’s guaranteed minimum. ECO₂ says 95% on average. ECO₂ Competitive Advantages, p.4
The cones put out 60 mg/L, as at the Trinity River Authority. That takes pressure where the water is released: by ECO₂’s rule, about 40.3 mg/L at no extra pressure and 1 mg/L more for each foot of head. ECO₂ case study Trinity River Authority, p.2ECO₂ Bulletin, oxygen demand, p.2
Each cone’s base is sized for water crossing it at 0.2 ft/s, about the speed published installations run at (our arithmetic), then rounded up to a size ECO₂ has listed, 2 to 12 ft. Up to 9,875 gpm a cone, the Trinity River Authority’s flow through a 12 ft cone. Our arithmetic Trinity River Authority, section 4.3ECO₂ Reference portfolio 2021, pp.4-23ECO₂ case study Trinity River Authority, p.2
The pump works against 12 ft of head, ECO₂’s figure for a low-pressure side stream, at 60% wire to water (our assumption, inside the published range). Water at 998.21 kg/m³. ECO₂ Competitive Advantages, p.6Our arithmetic US EPA 2023, slides 19-20Standard NIST WebBook
Liquid oxygen at $0.40 per 100 standard cubic feet, the price Ann Arbor, Michigan, awarded in 2026, at 12.076 cubic feet a pound. Made on site: 0.84 kWh a kg with PSA, 0.27 with VSA. The cost of on-site equipment isn’t included. Independent City of Ann Arbor 2026, resolutionStandard City of Topeka bid formIndependent PATH & CHAI 2021, p.2
Electricity at $0.10 a kWh, the price in ECO₂’s own costing example. Camanche Reservoir’s costs used $0.08. ECO₂ Bulletin, oxygen sources, p.3Independent Horne & Faisst 2022, Table 6, p.278
It runs every day of the year. Not included: equipment, standby cones, piping, controls and the site.
The method is a draft from published rules and examples, and ECO₂ hasn't reviewed it. ECO₂ designs every system to order and guarantees its performance.
How much of the oxygen gets into the water and the electricity it takes per lb of oxygen, from published sources. A clean-water rating is higher than what the same equipment does in sewage, so each figure says which it is. Lower energy is better.
| Method | Oxygen transfer | Electricity per lb of oxygen (kWh/lb) |
|---|---|---|
| Speece ConePure oxygen, dissolved under pressure in a closed cone. The oxygen is bought as liquid or made on site. | 95% on average; over 90% guaranteed and tested at start-up ECO₂ Competitive Advantages, p.4 95% or better in the U.S. Army Corps of Engineers’ own 60-day test at Savannah Harbor Independent U.S. Army Corps of Engineers 2019, p.1 95 to 98% at start-up in Milford, Connecticut, as the city’s consultants reported it Independent Bradstreet, Smith & Bowker (AECOM), Milford, p.15 | 0.20 kWh/lb to dissolve it, pumping only: ECO₂’s 400 kWh a ton ECO₂ Bulletin, aeration and oxygenation, p.2 Making the oxygen on site adds 0.12 kWh/lb with VSA to 0.38 with PSA. Liquid oxygen is bought in, with the energy to make it in its price. Independent PATH & CHAI 2021, p.2 |
| Fine-bubble diffusersAir blown through porous plates or membranes on the tank floor. | 13 to 40% in clean water at 15 ft Independent US EPA 1989, Table 2-2, p.27 In sewage, usually under half that: the field factor was 0.24 to 0.66 at the plants measured Independent US EPA 1989, Table 3-11, p.62 | 0.23 to 0.37 kWh/lb in clean water, as rated Independent Water Environment Federation 2017, Table 1, p.4 About 0.30 kWh/lb in wastewater, by EPA’s costing figure. Air is free: nothing to buy or make. Independent US EPA 1980, Fact Sheet 2.1.1, p.A-43 |
| Coarse-bubble diffusersAir through larger openings: bigger bubbles, less upkeep. | 9 to 13% in clean water at 15 ft Independent US EPA 1989, Table 2-2, p.27 4.8% in the field at the one plant measured Independent US EPA 1989, p.251 | 0.37 to 0.75 kWh/lb in clean water, as rated Independent Water Environment Federation 2017, Table 1, p.4 About 0.50 kWh/lb in wastewater, by EPA’s costing figure Independent US EPA 1980, Fact Sheet 2.1.1, p.A-43 |
| Surface aeratorsPaddles or impellers that throw water through the air. | None to quote: they splash water through the air instead of feeding in a gas, so they’re rated on energy Independent Stenstrom & Rosso 2010, slide 26 | 0.21 to 0.30 kWh/lb as rated, low speed Independent Water Environment Federation 2017, Table 1, p.4 0.36 to 0.65 kWh/lb in the field Independent New York State DEC, p.1 |
Sources and how small cones compare
Small cones absorb less. Ashley, Mavinic and Hall’s laboratory cone dissolved 35.8 to 61.1% of its oxygen; they say it never reached the design inlet speed. Independent Ashley, Mavinic & Hall 2008, Table 4, p.673
Their pilot cone reached 66 to 72% at best, by the paper’s abstract. Independent Ashley et al. 2014, abstract
No peer-reviewed paper reports a measured full-scale figure for a Speece Cone. The full-scale numbers above are an owner's test (the Army Corps) and a start-up result reported by a city's consultants (Milford). Energy figures in the other units are converted exactly: 1 hp is 0.7457 kW and 1 lb is 0.4536 kg.
- ECO₂, Superoxygenation System: Competitive Advantages
- U.S. Army Corps of Engineers, Savannah District (2019), Dissolved oxygen injection system a ‘remarkable success’
- Bradstreet, Smith (AECOM) & Bowker (about 2012), Use of Pure Oxygen to Control Odors and Corrosion in the Milford, Connecticut Sewer System
- ECO₂, Technical Bulletin: Comparing Aeration and Oxygenation
- PATH & Clinton Health Access Initiative (2021), Oxygen Generation and Storage: PSA/VSA Plant
- US EPA (1989), Design Manual: Fine Pore Aeration Systems, EPA/625/1-89/023
- Water Environment Federation (2017), Liquid Stream Fundamentals: Aeration Design
- US EPA (1980), Innovative and Alternative Technology Assessment Manual
- Stenstrom & Rosso (2010), Aeration (lecture slides, UCLA and UC Irvine)
- New York State DEC, Calculation of Oxygenation Capacity, Mechanical Surface Aerators
- Ashley, Mavinic & Hall (2008), Oxygenation performance of a laboratory-scale Speece Cone, Can. J. Civ. Eng. 35
- Ashley, Fattah, Mavinic & Kosari (2014), Design factors in the oxygen transfer of a pilot-scale Speece Cone, J. Environ. Eng. 140(3) (abstract)
No one has published a fully measured full-scale Speece Cone dataset, with the flow, the oxygen fed, the pressure and the oxygen out all measured together. So we checked the model against what is published.
- It reproduces McGinnis and Little's published model of a Speece Cone: a rise in dissolved oxygen of 105 mg/L against their 101, and 95.3% of the oxygen absorbed against their 93%.
- It fits the figures reported for the cone at Camanche Reservoir, California: 79.5 mg/L at 6 t/day to 104.0 mg/L at 8 t/day, against 80 mg/L and over 100 mg/L reported.
- It calls the gas pocket right in 15 of 18 of Ashley, Mavinic and Hall's laboratory runs.
| Check | Published or reported | Model estimate | Within tolerance |
|---|---|---|---|
| McGinnis and Little’s cone: rise in dissolved oxygen | 101 mg/L | 105 mg/L | Yes |
| McGinnis and Little’s cone: oxygen absorbed | 93.0% | 95.3% | Yes |
| McGinnis and Little’s cone: time a bubble spends in it | 62 s | 65 s | Yes |
| Camanche Reservoir: oxygen out at 23 m deep | 80 mg/L | 79.5 mg/L at 6 t/day to 104.0 mg/L at 8 t/day | Yes |
| Camanche Reservoir: oxygen out at the design feed | over 100 mg/L | 104.0 mg/L at 8 t/day | Yes |
| Camanche Reservoir: oxygen dissolved | nearly all: a bubble-free discharge | 97.7 to 98.5% | Yes |
| Ashley, Mavinic and Hall’s lab cone: runs where the gas pocket is called right | 18 runs | 15 of 18 | Yes |
| Oxygen solubility, 0 to 30 °C, against the standard tables | Benson and Krause (USGS) | within 2.0% | Yes |
What each check shows
McGinnis & Little's Speece Cone (1998)
Their discrete-bubble model's predictions for a 6 m cone (0.6 m across at the top, 3.6 m at the bottom) 50 m down, with 1.5 m³/s of water and 120 L/s of oxygen in 2 mm bubbles: Table 2, Table 3 (the same cone at six depths) and Fig. 3 (gas holdup).
This checks that the engine is McGinnis & Little's model, built right; it does not test the physics against a real cone. It runs 4.0% high on the rise in DO and 2.3 points high on absorption. Likely reasons: their dissolved-gas equation carries a 1/(1 − ε) factor the exact mass balance does not, they stepped in depth with Euler's method, and their own Table 2 is about 2% inconsistent (101 mg/L × 1.5 m³/s is 13,090 kg/day, not 12,800). The engine's peak holdup is higher than their Fig. 3 (4.6% against about 3% for 2 mm bubbles); their curve is drawn at 0.5 m steps, which would miss a sharp peak.
Camanche Reservoir, California (1993 onwards)
Horne et al. (2019): at the lower operating level, 23 m at the dam, the cone releases water at 80 mg/L (Speece's 1992 design figure), a bubble-free discharge, with 6 to 8 tonnes of oxygen a day in the first two years. Jung et al. (1998, EBMUD): the cone puts over 100 mg/L into the sidestream.
The reported 80 mg/L sits inside what the model gives for the 6 to 8 t/day fed (79.5 to 104.0 mg/L), and the model dissolves 98% or more of the oxygen, as a bubble-free discharge implies. That makes this a consistency check, not a sharp test: with almost all the oxygen dissolving, the outlet DO follows from the feed and the flow. The model also says this swarm is dense (holdup up to 15%), beyond the no-coalescence assumption.
Ashley et al.'s laboratory cone (2008)
A 75 cm laboratory cone 2.4 to 3.1 m under water, 38 to 133 L/min of water and 1 to 3 L/min of oxygen. The inlet was too slow for a swarm: the gas stayed as a pocket at the top in every run, except at 1 L/min of oxygen and over 50 cm/s, where the water purged it and forced bubbles out of the outlet.
The engine calls the pocket right in 15 of 18 runs. Where it misses (40 cm/s with 1 L/min (61% holdup); 50 cm/s with 1 L/min (56% holdup); 70 cm/s with 2 L/min (60% holdup)) it sees no pocket where one formed, with its swarm packed to over half gas, just under the 63.7% line it uses for one; the call there turns on that line and on the unreported bubble size and temperature. Their efficiencies (36 to 61%) are not compared: they are whole-tank figures from a cone running with a pocket, which a plug-flow bubble model cannot represent, and Ashley et al. say McGinnis & Little's assumptions did not hold in their cone.
Henry's law against the standard solubility tables
The O₂ and N₂ a litre of fresh water holds when saturated with air at 1 atm: Benson & Krause (1984), the USGS and Standard Methods standard, for O₂; Weiss (1970) for N₂.
The Wüest et al. (1992) fits McGinnis & Little used run up to 2.0% below the standards from 0 to 30 °C; the engine keeps them so it stays their model.
- McGinnis & Little (1998), Bubble dynamics and oxygen transfer in a Speece Cone, Water Sci. Technol. 37(2)
- Wüest, Brooks & Imboden (1992), Bubble plume modeling for lake restoration, Water Resour. Res. 28(12):3235-3250
- Horne et al. (2019), Hypolimnetic oxygenation 2, Lake and Reservoir Management 35(3)
- Jung, Sanders & Lai (EBMUD, 1998), Improving water quality through lake oxygenation at Camanche Reservoir, AWWA Water Quality Technology Conference
- Ashley, Mavinic & Hall (2008), Oxygenation performance of a laboratory-scale Speece Cone hypolimnetic aerator, Can. J. Civ. Eng. 35
- USGS Office of Water Quality Technical Memorandum 2011.03 (Benson & Krause 1980, 1984 equations)
- R. F. Weiss (1970), The solubility of nitrogen, oxygen and argon in water and seawater, Deep-Sea Res. 17:721-735
The engine and these cases are in our code, and a test holds the engine to each tolerance on every change.
About the model
It's an illustrative cone, about 10 ft tall and 6 ft across, half the size of the one McGinnis and Little modeled. The numbers come from their published bubble model, with the pressure and the temperature. They're model estimates, not ECO₂ design data or performance claims. The swarm in the picture follows the same model, and each bubble is drawn 30 times bigger than life. For real cones, ECO₂ guarantees over 90% of the oxygen dissolves and says 95% on average. The U.S. Army Corps of Engineers measured 95% or more in its own test.
Sources
- ECO₂ Technologies, Speece Cone wastewater and lake and river brochures (2023, 2025)A down-flow oxygen contactor; the cone's shape slows the water so the oxygen dissolves before it leaves at the bottom.
- R. E. Speece, Superoxygenation: Facts and Myths (ECO₂, about 2007)Bubbles need about 100 seconds of contact and rise at nominally 1 ft a second, so a plain tank would need to be 100 ft deep.
- R. E. Speece, Superoxygenation Applications in Wastewater Collection and Treatment Systems (ECO₂, about 2007)The cone traps the bubbles because the water comes in fast at the top and leaves slowly at the bottom.
- Ashley, Mavinic & Hall (2008), Oxygenation performance of a laboratory-scale Speece Cone hypolimnetic aerator, Can. J. Civ. Eng. 35Three zones: a fast zone at the top, the swarm in the middle where the water's speed matches the bubbles' rise, and a zone at the bottom where the last bubbles separate. Speece's design speeds: 10 ft/s in, 1 ft/s or less out.
- McGinnis & Little (1998), Bubble dynamics and oxygen transfer in a Speece Cone, Water Sci. Technol. 37(2)Water and oxygen go in together at the top; the bubbles are dragged down slowly as they dissolve; the bubble rise speeds the model uses.
- Horne et al. (2019), Hypolimnetic oxygenation 2, Lake and Reservoir Management 35(3)At Camanche Reservoir the water enters a 7 m cone at about 3 m/s and slows to under 0.1 m/s; the oxygenated water leaves at the base.
- Speece et al., US patent 7,566,397 (ECO Oxygen Technologies, 2009)A cone over a straight section with the outlet on the side near the bottom; the oxygen can go into the inlet pipe just before the cone.
- R. E. Speece, US patent 3,643,403, Downflow bubble contact aeration apparatus and method (1972)The original: the bubbles rise slower than the water at the top and faster than the water at the outlet, so they stay inside.
- ECO₂, Superoxygenation System: Competitive AdvantagesECO₂ guarantees over 90% of the oxygen dissolves, tested at start-up. It says 95% on average.
- U.S. Army Corps of Engineers, Savannah District (2019), Dissolved oxygen injection system a ‘remarkable success’The Army Corps' own 60-day test at Savannah Harbor: 95% or more of the oxygen dissolved, against an 80% target.
- Wüest, Brooks & Imboden (1992), Bubble plume modeling for lake restoration, Water Resour. Res. 28(12):3235-3250The fits McGinnis & Little use (their Table 1): bubble rise speed from Haberman & Morton's data, the transfer coefficient K_L from Motarjemi & Jameson's (1978), and Henry's constants for O₂ and N₂ against temperature.
- D. F. McGinnis (2000), Predicting Oxygen Transfer in Hypolimnetic Oxygenation Devices, MS thesis, Virginia TechChapter 3 reprints McGinnis & Little (1998): the cone's equations, Table 1's fits, Table 2's base case (101 mg/L, 93%, 62 s), Table 3's six depths and Fig. 3's holdup. Chapter 2 checks the same bubble model against a 14 m tank.
- USGS Office of Water Quality Technical Memorandum 2011.03 (Benson & Krause 1980, 1984 equations)The standard oxygen solubility in fresh water at 1 atm (eq. 7) and the vapor pressure of water (eq. 11), as the USGS and Standard Methods use them.
- R. F. Weiss (1970), The solubility of nitrogen, oxygen and argon in water and seawater, Deep-Sea Res. 17:721-735Nitrogen solubility from moist air at 1 atm, used to check the engine's N₂ Henry's constant; coefficients as coded by MBARI (N2sat_v1).
- MBARI, N2sat_v1: nitrogen saturation after Weiss (1970)Weiss's N₂ coefficients in mL/kg and the 22.404 L/mol molar volume used to turn them into moles.
- U.S. Standard Atmosphere, 1976 (NOAA, NASA, USAF)Dry air is 78.084% N₂ and 20.9476% O₂ by volume: the partial pressures of air-saturated water.
- CODATA 2018 recommended values (NIST): molar gas constantR = 8.314 462 618 J/(mol·K), exact since the 2019 SI. Standard gravity, 9.806 65 m/s², and the standard atmosphere, 101 325 Pa, are exact by definition.
- Meija et al. (2016), Atomic weights of the elements 2013 (IUPAC), Pure Appl. Chem. 88:265-291Conventional atomic weights O 15.999 and N 14.007, so O₂ is 31.998 g/mol and N₂ 28.014 g/mol.
- NIST Special Publication 811, Guide for the Use of the International System of Units (2008), Appendix BThe exact factors behind the US and metric units: gallon, foot, pound, pound-force, bar.
- Scott & Kilgour (1969), The density of random close packing of spheres, J. Phys. D 2:863-866 (reviewed by Torquato & Stillinger 2010)Spheres packed at random fill at most about 63.7% of a volume: the holdup at which the engine says separate bubbles must have merged into a pocket.
- Jung, Sanders & Lai (EBMUD, 1998), Improving water quality through lake oxygenation at Camanche Reservoir, AWWA Water Quality Technology ConferenceCamanche's cone puts over 100 mg/L of oxygen into the sidestream; the pump moves 35 cfs; about 270 t of oxygen went in over a year.
Read in October 2026. ECO₂'s papers were read from our copy of its technical library. Speece's 1990 design speeds are as Ashley, Mavinic and Hall give them. The sources for the presets, the sizing and the comparison are with each one.
Features
What we built.
- A three.js model you can turn, zoom and cut open
- Bubbles settle where the water's speed matches their rise
- Readouts from McGinnis and Little's published bubble model
- Application presets, temperature, pressure and US or metric units
- An illustrative sizing tool and a comparison with other ways to add oxygen
- The 3D code loads only when the model is near the screen
A concept we built for ECO₂ Technologies: its Speece Cone® as a working 3D model in the browser.
Turn it, zoom in, cut it open and change the flow and the oxygen. The bubbles settle where the water's downward speed matches their rise, as they do in a real cone. The readouts come from McGinnis and Little's published bubble model, with the sources listed in the app. The sizing tool and the comparison with other ways to add oxygen use illustrative numbers, labeled as such. They are not an ECO₂ engineering design.

Contact
What are you trying to make happen?
Most projects start with a short conversation. We listen to the brief, ask the right questions and tell you straight what we can handle and how. The first call is free.
Prefer to pick a time? Book a 30-minute call.
Or email us directly at info@whitelam.media.